
The National Average Is 346 Gallons Per Driver-Hour. Know Yours.
Propane delivery: 346 gallons an hour. Yours?
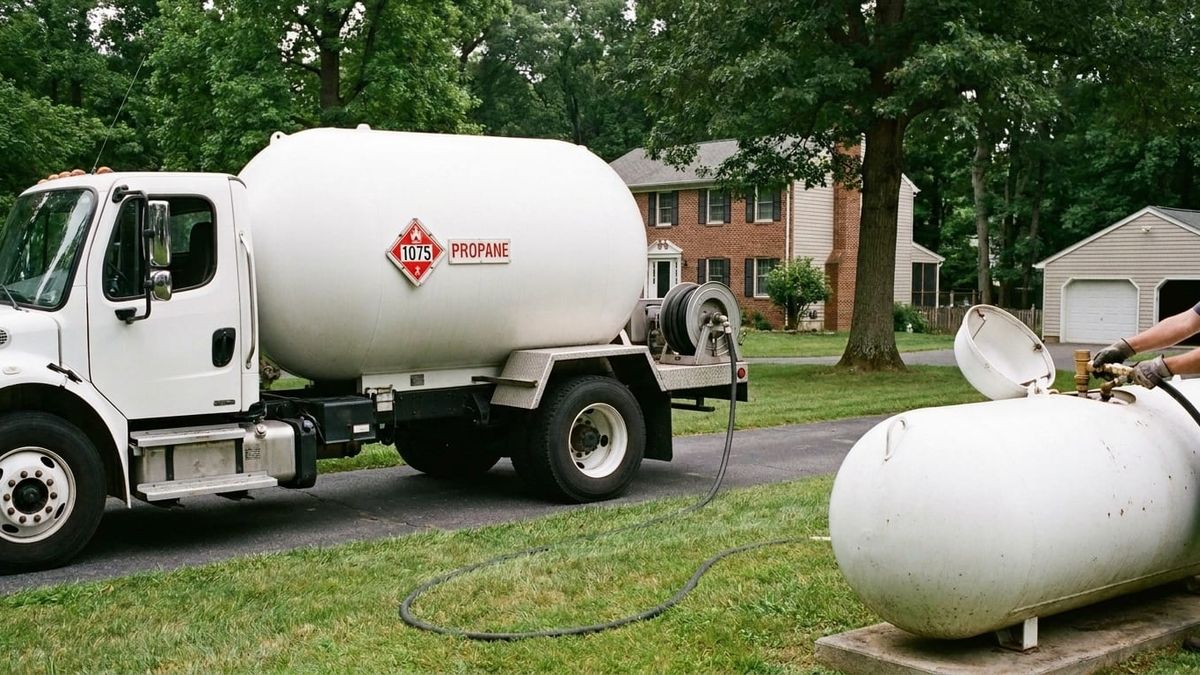
Gray, Gray & Gray's 2024 survey pegs the national average at 346 gallons per driver-hour. Pull last week's tickets, compute your own, and compare. If you are under, the levers are route density and will-call mix — and you own both.
The Situation
Gray, Gray & Gray's 2024 National Propane Industry Survey puts the national average at 346 gallons delivered per driver-hour, on 182 gallons per stop and 1.9 stops per hour, across the April 2023 to March 2024 heating season. You are the GM staring at payroll while trucks run farther for thinner drops. Do you know your own three numbers?
The Facts
The 2024 national picture. Gray, Gray & Gray's 2024 National Propane Industry Survey reports 182 gallons per stop, 1.9 stops per hour and 346 gallons per hour as national averages for the April 2023 through March 2024 season. Regional numbers run above and below that. Treat 346 as a yardstick, not a target handed down from anywhere.
One number a month will not show you this. An annual cost-per-gallon average can look stable while the driver-hour math moves underneath it. Gallons per stop and stops per hour are separate levers and they do not always move together. Track all three, or you will read a soft hour as a soft month.
Before you read a swing as a problem. Gallons per stop tracks how cold the winter ran as much as how the route was built. A warm season means smaller drops and a thinner hour with nothing wrong in dispatch and nobody underperforming. Compare your own numbers year over year, against your own degree-days, before you conclude anything about the route or the driver.
Where a GM can still move the number. Route density and the will-call mix are the levers you own. First-call-first-served dispatch burns the hour. Grouping stops in a tight zone protects stops per hour. Keep-full accounts protect gallons per stop better than a scatter of will-calls, and they smooth the season while they do it.
Training time still counts. A new CDL-plus-hazmat hire who does not know your fill procedure will sit in the yard and still hit payroll. Credential paths are shifting — confirm current CETP and PEP requirements with PERC and with your state LP-gas authority before you assume a driver's file is current.
Run your own three lines this week: gallons per stop, stops per hour, gallons per driver-hour. If you only watch gallons for the month, you will miss the hour.
Business Impact
Gray, Gray & Gray's 2024 survey gives you three national averages to measure against: 182 gallons per stop, 1.9 stops per hour, and 346 gallons per driver-hour. It cannot tell you your own number. A thin hour can come from a warm season that shrank every drop or from a route built looser than it needs to be — opposite problems with opposite fixes, and only your own three lines against your own degree-days will tell you which one you have.
What this means for your business: 1. Those averages cover the April 2023 through March 2024 season, and regional numbers run above and below them. 2. Gallons per stop moves with degree-days, so weather explains part of any gap before dispatch does. 3. Gallons per stop and stops per hour are separate levers that do not always move together, and a monthly gallons total hides both. 4. Compute gallons per driver-hour from last week's tickets and compare it to the 346-gallon average in the 2024 Gray, Gray & Gray survey.
Key Data Points
- 2024 Gray, Gray & Gray survey, national averages: 182 gallons/stop, 1.9 stops/hour, 346 gallons/hour.
- Survey period: April 2023 through March 2024.
- Regional averages run above and below the national figure.
- Gallons per stop is weather-sensitive; gallons per driver-hour therefore is too.
- CETP and PEP credential requirements are shifting — confirm current status with PERC and your state LP-gas authority.
Key Takeaways
- Gray, Gray & Gray's 2024 National Propane Industry Survey puts the national average at 346 gallons delivered per driver-hour.
- The same survey reports 182 gallons per stop and 1.9 stops per hour for the April 2023 to March 2024 season.
- Gallons per stop moves with the weather as much as with the route, so compare your own year over year against your own degree-days before drawing a conclusion.
- Will-call scatter and ungrouped dispatch are hours you can get back without adding a truck.
Action Steps
- 1.From last week's tickets, compute gallons per stop, stops per hour and gallons per driver-hour.
- 2.Compare your gallons per driver-hour to the national average of 346 gallons per driver-hour and note the gap.
- 3.Circle the will-call stops that sat alone in a zone and price what a keep-full conversion would have saved in miles.
- 4.List each driver's CETP or PEP status and state license date, and flag any card that is stale.
- 5.Bring those numbers and the credential list to this week's ops meeting and pick one zone to regroup.
Competitive Advantage
GMs who measure gallons per driver-hour catch a slow route before they post another hire. Tight zones and a current training file keep CDL time on the tank instead of in the yard. Start with one number this week: pull last week's tickets, divide gallons by driver-hours, and compare it to the 346-gallon national average. Then pick the single zone dragging it down and regroup that one before heating season.
Do you know last week's gallons per driver-hour, or only how many gallons the month is running?
Get the next one in your inbox.
Free propane industry news, twice a week. 30,000+ operators already read it.
No spam, unsubscribe anytime. We'll email you a link to confirm — that's how we keep the list real. See our privacy policy.
Published by PropaneInsider.com
AI-powered propane industry news for 30,000+ professionals